Cited in : Gorlia T, van den Bent MJ, Hegi ME, Mirimanoff RO, Weller M, Cairncross JG, Eisenhauer E, Belanger K, Brandes AA, Allgeier A, Lacombe D, Stupp R. Nomograms for predicting survival of patients with newly diagnosed glioblastoma: prognostic factor analysis of EORTC and NCIC trial 26981-22981/CE.3. Lancet Oncol. 2007 Dec 12
Population 1 (all randomized patients):
The nomogram was well calibrated for predictions of probability of survival at two years of up to 40%. Predictions beyond 40% tended to be underestimated, showing an inability to identify good prognosis patients. Corrections for optimism were small in all groups of patients (supplementary figure 7).
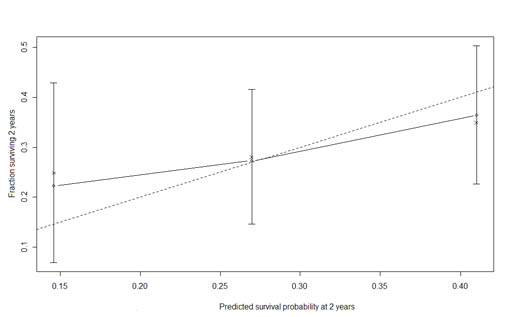
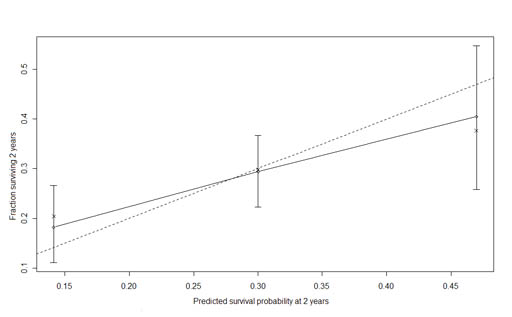
Predictions of RPA model tended to be overestimated in poor prognosis patients (RPA class V) and underestimated in good prognosis (RPA class III). It could not make any accurate prediction beyond 35%. Correction for optimism was large for RPA class IV (supplementary figure 8).
Population 2 (TMZ/RT treated patients):
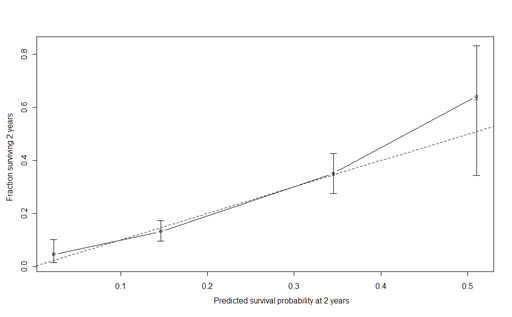
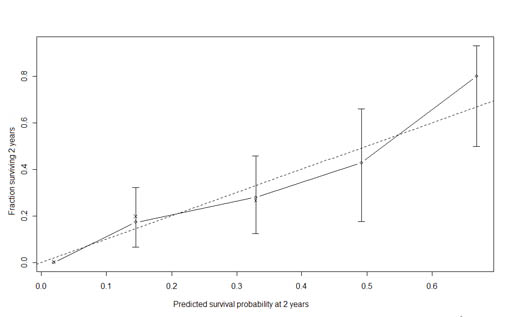
The nomogram was well calibrated for all groups. Predictions below 35% tended to be underestimated. Predictions in the range 35%-50% tended to be overestimated. Predictions beyond 50% were close to perfect. Corrections for optimism were small in all groups of patients (supplementary figure 9).
Predictions of RPA model showed the same pattern as in population 1. Corrections for optimism were large for RPA classes III and V indicating that inaccuracy would likely be larger if measured in an external dataset (supplementary figure 10).
Population 3 (TMZ/RT treated patients, resected tumor and MGMT promoter methylation status assessed):
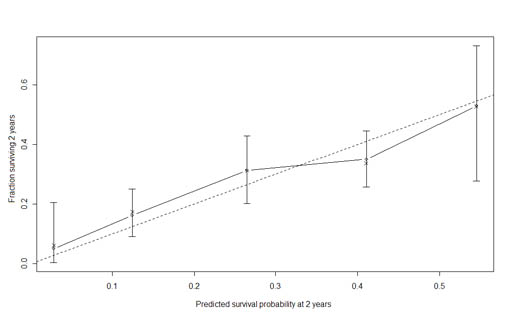
The nomogram was well calibrated for groups of low prognosis (<20%), provided slightly overestimated predictions for groups of prognosis between 25% and 55%. Predictions for groups over 55% were slightly underestimated. Corrections for optimism were small in all groups of patients (supplementary figure 11).
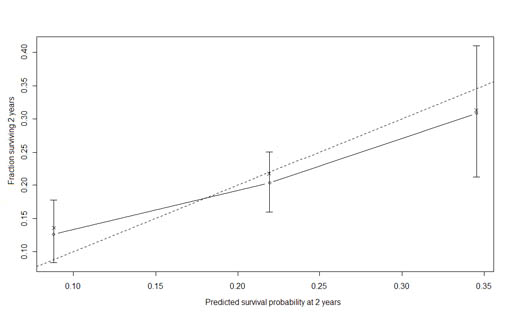
Predictions of RPA model showed the same pattern as in populations 1 and 2. Correction for optimism was large for RPA classes III (supplementary figure 12).
In conclusion, based on measure of discrimination and calibration, accuracy of the predictions produced by the nomograms was superior to those of the RPA classification.
Supplementary table 1. Concordance Indexes corrected for optimism of the nomograms and RPA classification in the three study populations.
Concordance-index corrected for optimism |
Population 1 ‡ |
Population 2 ‡ |
Population 3 ‡ |
RPA classification |
58.4% |
58.9% |
55.5% |
Nomograms |
65.0% |
63.0% |
65.5% |
Legend: ‡ Population 1: all randomized patients (ITT), population 2 : all patients treated by TMZ/RT, population 3: patients who underwent partial or complete resection treated by TMZ/RT with MGMT assessment available.
Supplementary Figure 7. Calibration plot of the nomogram fit on all randomized patients (population 1) .
Supplementary Figure 8. Calibration plot of a Cox model based on the RPA classification fit on all randomized patients (population 1) .
Supplementary Figure 9. Calibration plot of the nomogram fit in patients treated by TMZ/RT (population 2).
Supplementary Figure 10. Calibration plot of a Cox model based on the RPA classification fit in patients treated by TMZ/RT (population 2) .
Supplementary Figure 11. Calibration plot of the nomogram fit in patients treated by TMZ/RT who underwent complete or partial resection in presence of MGMT promoter methylation status assessment (population 3) .
Supplementary Figure 12. Calibration plot of a Cox model based on the RPA classification fit in patients treated by TMZ/RT who underwent complete or partial resection in presence of MGMT promoter methylation status assessment (population 3).